UPDATED MARCH 2022
Syllabus
Techniques for representing the design of a digital product; annotated diagrams/sketches, storyboards, wireframe and grid 11 GEN
Techniques for the representation of a design plan including; annotated digital diagrams/ sketches storyboards, annotated notes, thumbnails 12 GEN
Components of a design plan; storyboard, thumbnails (hand/digital), wireframes/sketches(hand/digital) 11 ATAR
Project planning tools storyboards, site maps, flow charts 12 ATAR
Background
For any project it is important to do planning so that we have an idea of what it is going to look like. This plan can then be used as a point of discussion for a client. The design plan shows what the product may look like.
Annotated diagrams, sketches, wireframe and grid
- These are rough sketches that show what the product may look like.
- Annotations are notes written around the outside of the sketch.
- These can be hand drawn or they can be done on a computer (digital)
- Grid means they have grid paper so you can line up the sides of objects better
- Visit http://alistapart.com/article/sketching-the-visual-thinking-power-tool to see how these can be used to show ideas for the product
- download wireframe grid sheets free from here. photoshop grid sheets also available
- download mobile phone sketch sheets to use free here
- Visit wikipedia for more details on wireframes, or wireframe on website design templates
Sitemaps
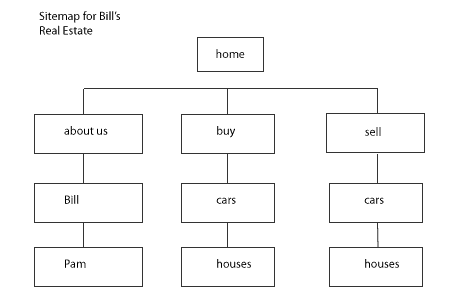
- A sitemap is a one page picture showing the whole structure of a website
- It shows all the webpages on a website
- It is used in 2 places. One in planning for a website. Two is actually on the finished website which is hyperlinked. eg see example here
- To draw a sitemap plan use rectangles joined together by lines
- Draw a home page box, under that draw boxes for other webpages.

Flowchart
- A flowchart is a series of boxes joined by lines that show flow of information
- the boxes show the things/nouns and the lines show the flow of data between them. The data flow can go both ways
- NOTE: image below from http://www.edm-consulting.com/design_services.html#

Storyboards
- A storyboard is a sequence of pictures showing details for a product
- These can be hand drawn, or made on a computer, there are even online versions (but they are a bit limited in what you can do)
- Visit http://www.instructionaldesign.org/storyboarding.html , find advantages and disadvantages of storyboarding.
- Visit http://www.lynda.com/Web-User-Experience-tutorials/UX-Design-Techniques-Creating-Scenarios-Storyboards/148581-2.html to see the storyboard course at lynda.com Just close the popup window to watch the movie (1 min 24 secs)
Thumbnails
- A thumbnail is a small version of a larger picture
- It is quick to load on a webpage
- Thumbnails take up less space on the webpage
- They show a version of the image, if you like it, you click it to make it bigger.
- An example of this is google images, where you search the thumbnails to find the picture you want.
- It is used in design planning; to show placeholders where images will go in a design.
- You draw a thumbnail of the actual picture
FOR YOU TO DO
1. Learn the above points.
2. Apply these diagram and sketch techniques to your design planning.
Found an error or enhancement? Please fill out this contact us form.

